Who Responded & Where They Came From
The survey closed on 27 April 2026 with 134 completed responses over a three-week window (target was 200). This sub-section profiles who responded, where they came from, and how they travelled to 5 Bridges — the foundation for the value, impact, and priority findings that follow.
Sample profile
| Profile dimension | Snapshot |
|---|---|
| Connection | 40% regular users (weekly+); 31% occasional; 15% visited a few times; remainder includes parents/guardians, supporters, instructors, and shop owners. |
| Recency | 57% used 5 Bridges within the last month before closure — a recent-user base, not nostalgia. |
| Primary activity | Skateboarding 75%; inline/roller 10%; BMX 8%; scooter 2%; spectating/social 4%. |
| Age | 12–17: 5%; 18–24: 18%; 25–34: 32%; 35–44: 27%; 45–54: 15%; 55+: 3%; prefer not to say: 1%. |
| Gender | 84% male; 15% female; 1% non-binary. |
| Ethnicity | 91% White British; 9% other groups or undisclosed. |
| Skill level | 48% advanced; 42% intermediate; 5% beginner; 3% professional/competitive; 3% parent/supporter. |
| Years in the activity | 53% over 10 years; 15% 5–10; 13% 3–5; 13% 1–3; 3% under 1 year. |
| Accessibility needs | 1.5% identified an accessibility need to be designed for. |
Note on representativeness. The sample over-represents experienced adult skaters and under-represents under-18s, women, and beginners. The Phase 2 follow-up plan in § 2.5 is designed to close those gaps.
Where they came from
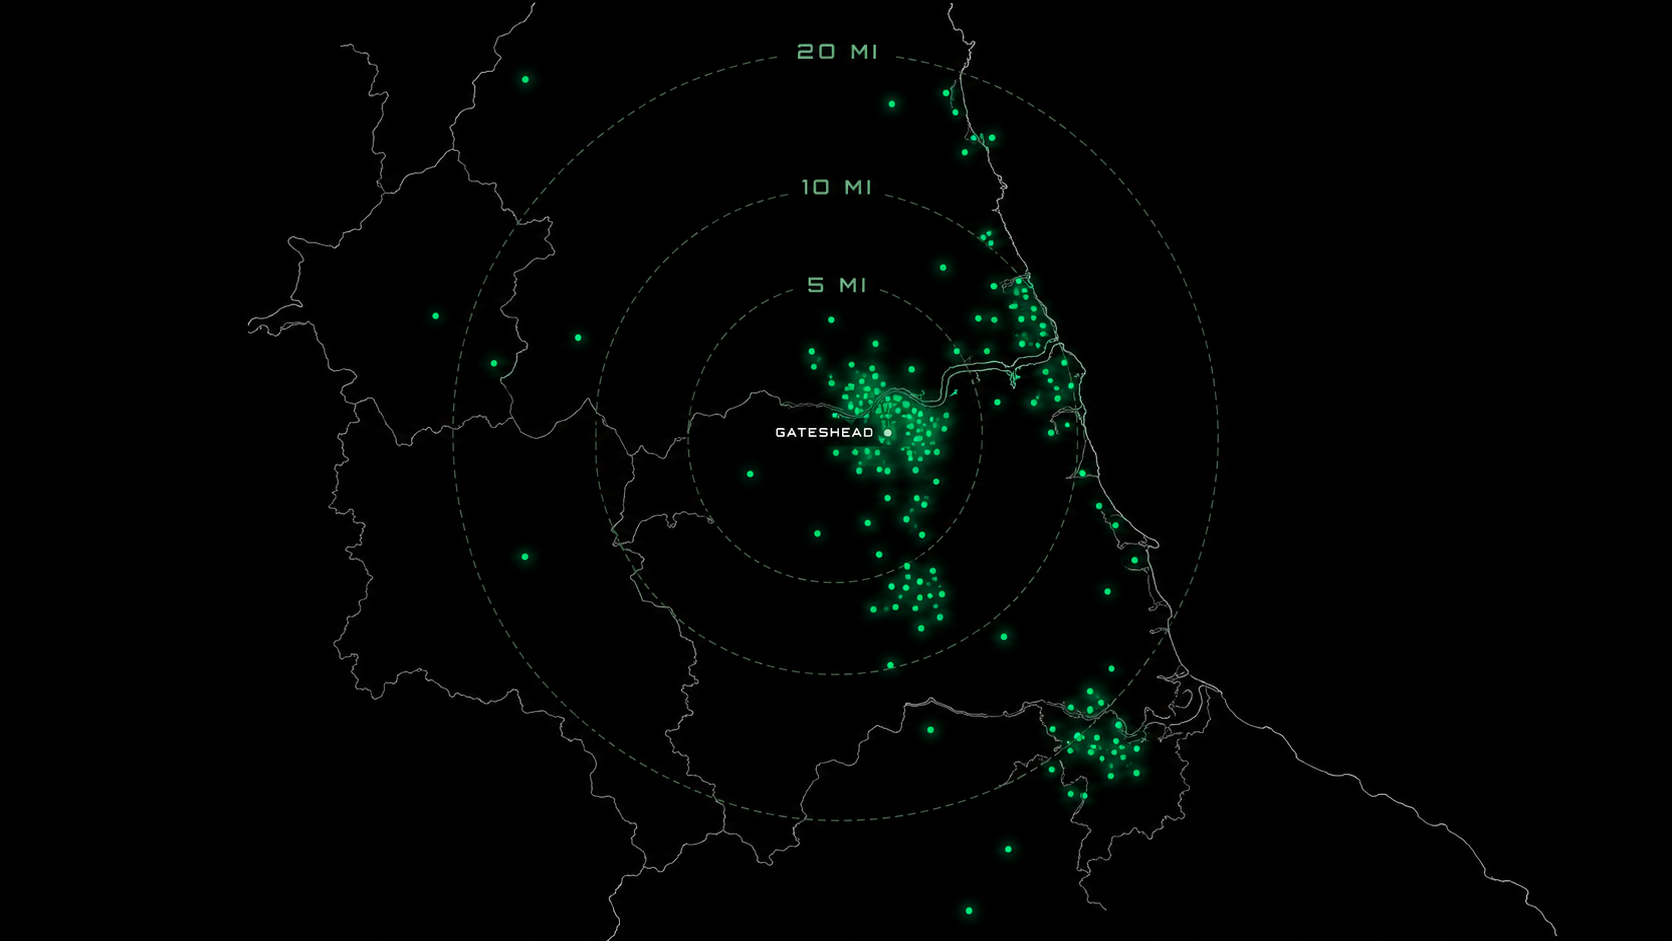
Figure 2.4.1a — Geographic spread of the 134 respondents (catchment map, illustrative).
- Catchment is regional, not borough-bound. Postcodes span 52 distinct prefixes across the Tyne and Wear conurbation (NE, SR), County Durham (DH1–DH9), Northumberland (NE61–NE64), Teesside (TS14, TS18, TS19, TS25, TS26), and as far as YO21.
- Top concentrations: NE9 Low Fell, NE10 Felling, NE8 Gateshead centre, NE11 Dunston, NE28 Wallsend, NE38 Washington.
- Distance travelled: 56% travelled 5+ miles to reach 5 Bridges; 29% travelled more than 10 miles. The covered facility was a regional, not local, asset.
Figure 2.4.1b — Distance respondents travelled to reach 5 Bridges (n=134).
How they travelled
Cars accounted for the majority of journeys (47% drove themselves, 10% were dropped off — 57% combined). Public transport (Metro + bus) covered a quarter, and active travel (cycle, skate, scoot, walk) accounted for 18%. Public-transport access matters but car dominance in the data tempers any assumption that town-centre proximity is decisive (see also § 2.4.3 The Replacement).
Figure 2.4.1c — Primary travel mode to 5 Bridges (n=134).
Willingness to travel further
When asked whether they would travel further than they did to 5 Bridges if the new facility were higher quality:
- 62% — Yes, I'd travel further for a better facility
- 33% — Maybe, depending on how much better it was
- 4% — No, I need it as close or closer
- 1% — Not sure
95% are open to travelling further in exchange for higher quality. Combined with the 5+ mile catchment evidence above, this gives the project explicit permission for the location trade-offs the shortlisted sites all make. This finding is the basis for the priority hierarchy unpacked in § 2.4.3.