What 5 Bridges Was — And What Closure Took
Before exploring what a replacement should look like, the survey established what 5 Bridges actually was to its community — what people valued, how the build itself rated, and what closure has cost. The findings here are the evidence base for the priority hierarchy in § 2.4.3.
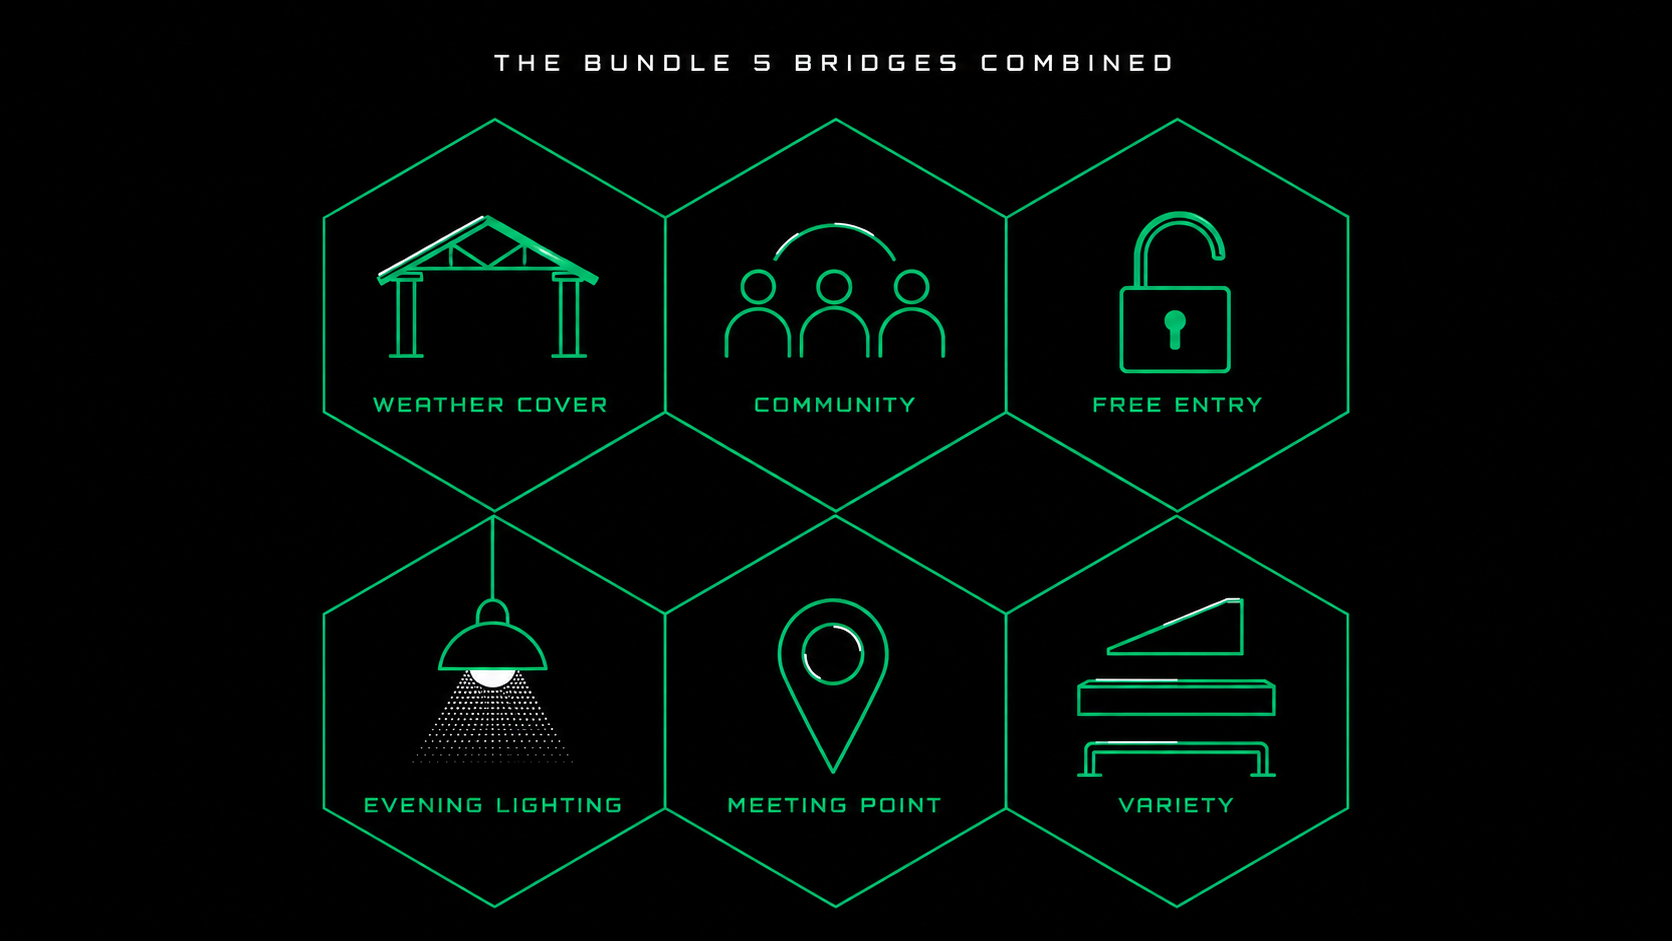
Figure 2.4.2a — The bundle of attributes 5 Bridges combined, which no other facility in the region replicated.
What people valued about 5 Bridges
Respondents ranked their top three values. The chart below shows first-place rankings — the count of respondents who placed each option first. The full top-three breakdown follows the chart.
Figure 2.4.2b — First-place rankings for what people valued most about 5 Bridges (n=134, top-3 ranking question).
| Value driver | Ranked 1st | Ranked top-3 |
|---|---|---|
| Protection from weather (covered by flyover) | 116 | 130 |
| Free to use | 59 | 101 |
| Community / social atmosphere | 48 | 78 |
| Lighting for evening use | 41 | 68 |
| Central meeting point | 34 | 49 |
| Variety of features | 28 | 65 |
| Quality of equipment / obstacles | 28 | 63 |
| Size of the facility | 26 | 50 |
| Town centre location | 22 | 51 |
| Metro / public transport access | 19 | 52 |
How the closure has affected the community
Personal impact (multi-select, n=134):
Figure 2.4.2c — Personal impact of the closure of 5 Bridges (n=134, multi-select; respondents could select all that apply).
Figure 2.4.2d — Change in personal skating/riding activity since 5 Bridges closed (n=134).
The existing-parks gap
87% of respondents have not found a working alternative within Gateshead.
Asked whether other Gateshead parks have stepped into the void:
- 63% — No, I haven't found a suitable alternative
- 24% — I've tried them but they don't meet my needs
- 8% — Yes, occasionally
- 4% — Stopped skating / riding
- 2% — Yes, regularly
Of those who tried alternatives, the top reasons they fall short are exactly the bundle of attributes 5 Bridges provided:
This corroborates the existing-parks hypothesis tested in § 3 with community evidence rather than methodology alone.